On this post I added improvements to the filter and begin training the agent. In addition, I will be talking about using Genetic Algorithm (GA) as a method of optimization for the AI’s parameters while training
Filter problems and improvements
I began adding improvements to the filter by adjusting the variable names so that they were more accurate to their use. Additionally, I’ve replaced re.sub with string.replace due to it causing errors when switching from my personal computer to a university computer, this is likely due to my computer having a different version of Python compared to the university computer. A screenshot of the improved code this is shown in fig 1.

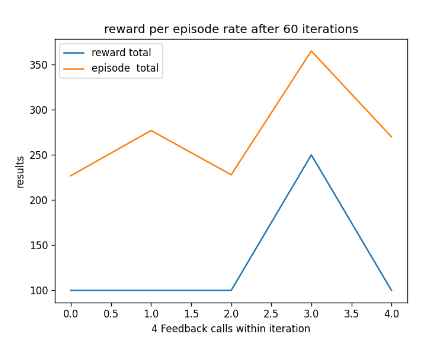
In addition, the filter is now able to plot graphs of all the data over each eval callback and plot a graph that shows the average episode and reward over each callback. Two examples of the graphs are shown below in fig 2 and 3.

When working on the filter and how it would work with the graph I was not sure if I should have the graph function preform a loop (based on current amount of data) when plotting each graph or if the filter should just call the plotting function to avoid code duplication. In the end I had the filter call the plot function when it had finished filtering the data but was still in the loop. This way each graph was plotted one at a time.
While I would have liked the function return a value for the plot graph to use, for the time being it is a good solution I intend to add improvements as develop goes on.
Plot function problems and improvements
For the plot function I had to rethink how the plotting function would use its parameters to work with the filter function as the filter was now calling the function. This problem did not have much of an impact on the scope of the AI development as I believed that I was able to rearrange the system architecture quite quickly.
To ensure that the plot function was compatible with the filter I removed the data parameter that contained the csv data and replaced it with two parameters for the y-axis data (where the filtered data is used) as well as three other string parameters for the labels and the graph’s title. This was to ensure that the graph could be as dynamic as possible while not going too far causing the function to be overly complex.
The quality of the solution had worked quite well and will remain as the current solution for the AI and how it plots graphs. This is to ensure that the user could have more control over how the graph was plotted.
Training and genetic algorithm optimization
Now that data can be displayed and the AI is functional, I began training my agent to play Asterix (1983) and adjust its step amount & learning rate parameters to determine how often it should train to get the best results. However, although it might be simple to change some of the parameters randomly to triangulate on the best parameter value by hand, due to the complexity of the game this would be a problem, as it would take quite a bit of time to find the best parameters.
Fortunately there is an alternative, which is using algorithms to optimize the best parameter values. I had two choices, the first was to use hill climbing, which will pick random values to use as the parameter and try and find the best value by climbing up from that value, however there are chances it will get stuck. To prevent it from getting stuck in a local optimization that only fits the current machine learning agent, you can set how many times it can guess a starting point. While this algorithm does work, as mentioned earlier it can get stuck and it’s starting points are random preventing you from having some control of its output (Bryan 2021).
The second option is Genetic Algorithm (GA) which is based off biology and takes a population approach, by combing individuals in a population with each other through crossover & mutated to generate some new and hopefully better parameters (Bryan 2021).
An example of crossover and mutation is shown below in fig 4.

In this case there were two populations one was the learning rate and the other was the step rate.
The tournament is used to find the best individual within the populations based on its performance in hopes that the next generation will adopt their best traits. This is achieved by testing the individual and seeing what results come back. After this, the individual will be added to the mating pool for crossover and mutation (Miller and Goldberg 1995).
The crossover is achieved by dividing both the parent’s genomes into two and then swapping the chosen halves with one another (Gad 2018). Since this genome contains both the learning rate and episode rate, the division will be done based on this rather than dividing the genome at random.
Crossover is done to ensure that the offspring is different from the parent populations and doesn’t share any identical traits. After that mutation is applied to the offspring to by selecting one of the genes and changing its value at random. This is a second layer of variation, because without it the offspring would just contain traits of both parents. This would mean no individual traits that could be helpful when being used for the new parameter or as a parent to make the next offspring more diverse (Gad 2018).
To show of how the optimization works with the AI system, below in fig 5 is a UML of the system architecture.

Example of training
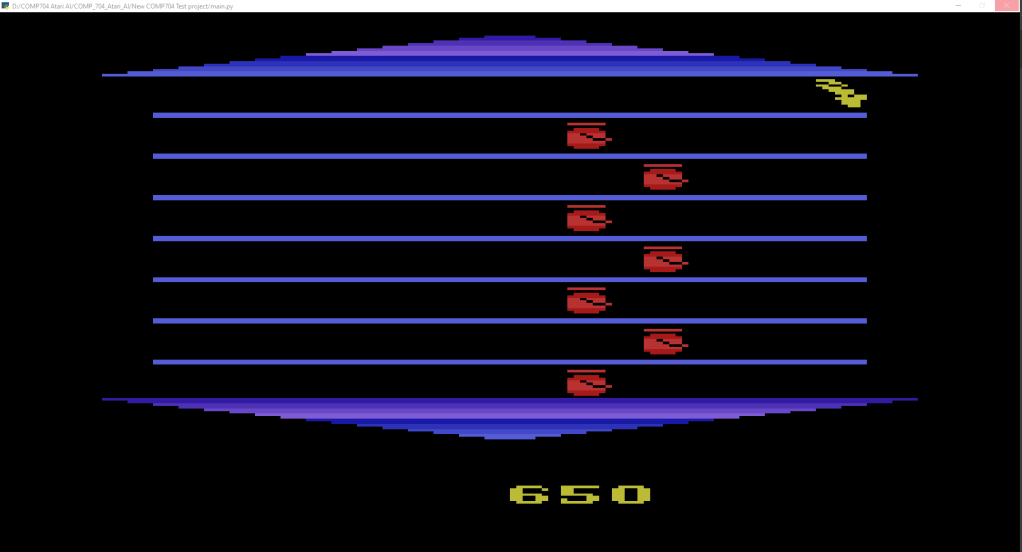
I began training my AI using the GA optimization and it has successfully be able to train the AI to play Asterix(1983). Though the training did take some time especially with new generations being created, in about 2 minutes it was able to reach the highest score in the game (650 points). A screenshot is shown below in fig 6.
However, the AI maybe playing too well, over time it found a limitation in the game where staying in one of the corners and wait for the collectables to move to the agent was better than moving around. Because of this is means the AI is ‘overfitted’ and may need to have its parameters adjusted so that it preforms less efficiently (Gerrish 2018). A video of it overfitting is shown below in fig 7.
Problems with GA optimization
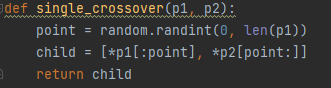
The crossover function was returning individuals that were either empty or combined the wrong way e.g. [learn rate, episode rate] []. In order for it to work, the episode rate needed to be the first element in the array and the learn rate the second one. by using * operator both arrays could be combines properly without any problems. In addition the : operator was used in the lists to get every element up until a random point in both populations. This was done to ensure variations could be applied to the individuals that where being added to the next population, this made the scope of the problem quite small as an effective solution was found relatively soon. An example of the code could be shown below in fig 8.
Another part of the optimization that I was having trouble with was the mutation part of the algorithm. I was trying to increase or decrease the step total and the learning rate to add individual traits to the offspring, however I seemed to be facing a problem, as for some reason the mutated learning rate came back as negative, which causes the AI to break down and stop. This is shown below in fig 9 and fig 10.


I believe this was happening because of the while loop parameters and that possible the ‘randomlearnrate’ variable due to the variable being initialized before the while loop and thus it possibly wasn’t being considered.
To see if this was the case, I replaced the while loop parameters with an if statement inside of the loop to ensure that ‘randomlearnrate’ wasn’t being initialized before hand.

This change worked as negative numbers were not being produced and the mutations where successfully added to the DQN parameters making the solution an effective one that will stay as is for the foreseeable future. This is shown below in fig 12. For reference, the ‘mutation’ print shows that the mutations are being applied.

As for the step total, there was no problem with mutating that value as it didn’t need to be within 0 to 1, meaning simply adding a random number to it was not a problem.
Improvements
An improvements I did to the code was change the number of total steps, as on further inspection of the parameter I realized that the parameter must be an integer (whole number) and while I have experienced no errors I want to make sure that everything was ok and that the data was accurate.
Further enquires
Looking at how GAs work and how an their performance I was curious if there could be other methods (besides hill climbing) that could allow for better AI optimization. Ideally I would compare different optimization techniques to see if faster ones could be used and if they yield better quality from their faster results. Of course a limitation would be time constraints since each one would require being implanted and set up to the AI. Addition, each one may require a different AI technique. An example of another algorithm for optimization would be MIMIC which works by remembering previous searching in order to optimize and break down the complexity space within the function rather than looking at a single input (BRYAN, 2021).
The point of the experiment is to see if a different optimization technique can just as good or better results at a faster pace.
Reflection and conclusion
Upon reflection of my work I’m happy the filter is working and that the plot is able to successfully plot graphs based on the data from the csv file. In addition, I found it very interesting to incorporate the GA algorithm on to my AI so that it step total and learning rate parameters could be optimized automatically, especially since this is my first time using it.
Though the AI is able to play Asterix(1983) very efficiently, I should begin experimenting to see if I can reduce the efficiency of AI so that it is not overfitting while still being able to play the game well.
In addition, the filter and graph work really well, however I learned quickly that I may need to adjust how often a graph is plotted since within one generation, 580 graphs had been plotted, a picture is shown below.

To improve on this I will adjust the graph and how the filter uses the function so that it plots a graph of the average of the AI’s performance after every iteration or after every generation.
For my next bit of work I will be adding improvements to the filter and how the graph uses it so that the user is not over whelmed with graphs. Additionally, I will be adjusting the optimization of the AI so that it can play the game with reasonable results while not overfitting.
Bibliography
Asterix. 1983. Atari, inc, Atari, inc.
BRYAN, Graham. 2021. ‘Randomized Optimization in Machine Learning’. Available at: https://medium.com/geekculture/randomized-optimization-in-machine-learning-928b22cf87fe. [Accessed Feb 11,].
GAD, Ahmed. 2018. ‘Introduction to Optimization with Genetic Algorithm’. Available at: https://towardsdatascience.com/introduction-to-optimization-with-genetic-algorithm-2f5001d9964b. [Accessed Feb 11,].
GERRISH, Sean. 2018. How Smart Machines Think. Cambridge, MA: MIT Press.
MILLER, Brad L. and David E. GOLDBERG. 1995. ‘Genetic Algorithms, Tournament Selection, and the Effects of Noise’. Complex Syst., 9.
Figure List
Figure 1: Max Oates. 2022. improved variable names.
Figure 2: Max Oates. 2022. graph of rewards and episodes over 4 feedback calls.
Figure 3: Max Oates. 2022. graph of averaged data.
Figure 4: Ahmed Gad. ca. 2018. crossover and mutation. [diagram]. V&A [online]. Available at: https://towardsdatascience.com/introduction-to-optimization-with-genetic-algorithm-2f5001d9964b [Accessed Feb 11,].
Figure 5: Max Oates. 2022. picture of AI architecture
Figure 6: Max Oates. 2022. Asterix AI with a high score.
Figure 7: Max Oates. 2022. video example of AI overfitting.
Figure 8: Max Oates. 2022. screenshot of single crossover function.
Figure 9: Max Oates. 2022. example of learning rate not accepting negative number.
Figure 10: Max Oates. 2022. screenshot of old while loop.
Figure 11: Max Oates. 2022. screenshot of new while loop.
Figure 12: Max Oates. 2022. screenshot of mutation preformed on new population.
Figure 13: Max Oates. 2022. plotted graph after 580 iteration.
