In this post I talk about how I began displaying the stored data on graphs, the problems I faced and how I overcame them.
Beginning
Starting off I wanted to have a graph that would show how many episodes each iteration had done and the reward that the agent got from that iteration. I imagined converting the data from a csv file to a graph would be simple, however I was surprised to see that the data was stored as an array and then displayed on the graph as so.

The data from the csv file was accessed using data.iloc, by itself this will return all the data from the csv file, hence why the graph looks the way it does. However, I found that if you treat the code like an array, you can tell it to return specific columns and rows. For example, by using data.iloc[1] will return everything on column 2 as [0] represents column 1 and then if I use data.iloc[1][1] I can access the data specifically on column 2, row 3 as it would appear that data.iloc[1][0] returns column 2, row 2 (lynn, 2017). An example of the code can be found later in fig 3 when being used to access data from column 2, row 3 and 4 of the csv file.
Also to specify, ‘data’ is a variable containing the information pandas’s read_csv function returned when called, which was used to retrieve the data from the csv file.
Problems
As mentioned earlier, the arrays containing the data for each iteration are displayed on the graph. This was due to the data for each iteration being stored on each cell of the table in the csv and was being stored as text rather than a number. Looking at my code as well as how and when the data is saved I believe this problem occurred due to how NumPy converted the NPZ file to a CSV files. This is shown in fig 2.

Because of this there were problems with Matplotlib as its functions couldn’t organise the data by themselves. I began by seeing if any of the parameters for the eval callback’s and NumPy’s functions could be changed to ensure the data was stored differently. However, this proved to not be the case, meaning this problem could have a large impact on the development scope as custom alternatives would be required. From this I decided to create my own filter that could break down the string stored on cell B3 and B4 into their separate numbers and then convert them from strings into floats.
Originally I started off using an ‘if statement’ that would ensure that if the retrieved data had a square bracket it wouldn’t be added to the list being used for the graph. The code is shown below in fig 3.
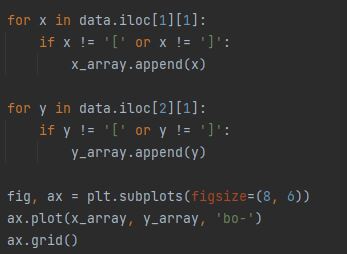
The code was working to some degree, however it broke down the numbers into single digit values including the square brackets, causing the graphs to appear unorganized on the y-axis. It might also store the values in an entire string preventing the graph from being plotted at all, as the string couldn’t be converted to a float. This is shown in fig 4 and 5.


Additionally, due to the size of the data for the x and y axis, it didn’t always have the same size, causing more errors to appear as Matplotlib did not want to plot a graph with different sizes of data.

Improvements
To solve the problems with the data I improved the filter so that it could remove unnecessary bits of text such as square brackets ([]) and being able to convert data from a single string of text into an array of texts. One of the challenges was that the filter needed to know when to break down the numbers. Firstly, I used re.sub from the re module to remove the square brackets from both text string that I was taking from the 2nd and 3rd row of the 2nd column (Lutz 2014).

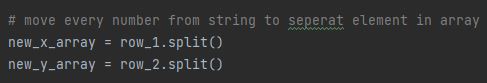
I then had each string variable broken up and stored into separate arrays using the split function and had, white space and full stop as the parameters. This is because when looking at the csv file, white spacing or a full stop appeared to be what divided the numbers. A screenshot of the code is shown below.

However, there was a problem, for some reason the split function wasn’t working despite the parameters being set up properly. It might be possible that the ‘|’ causing confusion as that’s meant to tell the function to look for spaces and full stops separately, however depending on the version of python, it may have just been looking for ‘ |.’ in the string.
Fortunately this problem was solved quickly by simply removing the parameters from the function. This is because by default the function will look for spacing when attempting to split the string (Lutz 2014). The code is shown below in fig 9.
Data being displayed
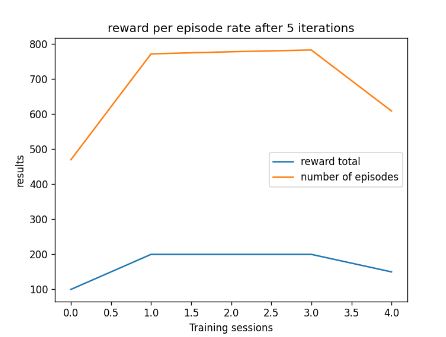
After correcting the code I was able to plot a graph that shows the total of episodes and the reward total after 4 iterations. While I was adding these improvements I decided that instead of displaying a graph with the number of episodes on the x-axis and the total reward on the y-axis, I decided to compare the reward total and episode total (y-axis) to the number of iterations before the first eval callback (x-axis). As you can see from the image below in fig 10 their is a correlation between the number of episodes and the reward total it achieves.
Further enquires
Looking at how the data from the converted data from the npz to csv is stored and as mentioned before there are no parameters that could be adjusted transfer the data differently. If I had the time I would look into an alternative system that could store each bit of the data into separate cells of the csv when rather than each bit of the data being stored entirely into a single cell. One of the problems of this pursuit is that it would require lots of research into computer science and an understanding of what npz files are and how they store data so that I could collect the right bits of data. This would add to the time required to design and make the system in the first place, but it would allow for more control on how the data is stored in each cell of the csv. This in turn would remove the need for the custom filter I have built.
Reflection and conclusion
Looking at the work I’ve done to the filter and displaying the data, I’ve found it quite interesting and am glad to see it working properly. The filter is able to successfully break down the data into its separate numbers and convert from text to numbers for the graph to use. The function could be more robust and dynamic, such as having a parameter that tells it to lookout for characters that aren’t just square brackets or empty space. However, due to scope and time, I didn’t want to focus too much time on this solution as a day had already be spent getting it functional. That being said, I aim to polish some of the code such as renaming the variables for the x and y array to y1 and y2 so that the viewer is aware that both arrays in the filter are used for the y-axis of the graph.
For the next post I intend to have the filter to be able to produce both graphs for different iterations of the agent during its training and produce a graph that shows the average reward and episode total per each iteration, throughout the training process.
Speaking of training, I aim to have begun experimenting with the agent’s parameters to see how the agent improves and would be its best settings for the agent to play the game properly.
Bibliography
LUTZ, Mark. 2014. Python Pocket Reference . (5th edn). United States of America: O’REILLY.
LYNN, Shane. 2017. ‘Pandas Iloc and Loc – Quickly Select Rows and Columns in DataFrames’. Available at: https://www.shanelynn.ie/pandas-iloc-loc-select-rows-and-columns-dataframe/comment-page-1/#comments. [Accessed Feb 18,].
Figure List
Figure 1: Max Oates. 2022. graph displaying arrays of data.
Figure 2: Max Oates. 2022. example of the training data being stored a csv file.
Figure 3: Max Oates. 2022. example of first iteration of data filter.
Figure 4: Max Oates. 2022. example of results from filter.
Figure 5: Max Oates. 2022. example of errors caused by filter.
Figure 6: Max Oates. 2022. example of errors when plot graph with uneven data sizes.
Figure 7: Max Oates. 2022. example of filter with improvements.
Figure 8: Max Oates. 2022. example of split function being used.
Figure 9: Max Oates. 2022. screenshot of improvements to the split function.
Figure 10: Max Oates. 2022. screenshot of graph from working filter.
